Complex IT infrastructures generate large volumes of infrastructure, performance, and configuration data every day. TRIN[IT]Y provides a centralized overview of systems, dependencies, and changes, making IT infrastructure relationships traceable over the long term.
Many performance issues do not arise suddenly, but develop gradually over time. TRIN[IT]Y analyzes historical and current data, evaluates changes based on learned system behavior, and helps administrators use intelligent predictive alerting to identify critical trends more quickly and transparently.
Long-term IT infrastructure decisions require a reliable data foundation. TRIN[IT]Y provides transparency regarding utilization rates, trends, and system developments, helping organizations make more informed plans for capacity, optimization, and investment decisions based on long-term trends.
Experience TRIN[IT]Y live
During a one-on-one online session, we’ll show you live how TRIN[IT]Y works, which features are relevant to your IT infrastructure, and what opportunities it offers for analysis, planning, and troubleshooting.
TRIN[IT]Y centrally consolidates data sources such as NMON, HMC, SAN switches, power and x86 servers, as well as storage and virtualization systems. In addition, external data sources and customer-specific information can be integrated via standardized interfaces such as ODBC, SSH, or SMTP and analyzed alongside infrastructure and performance data.
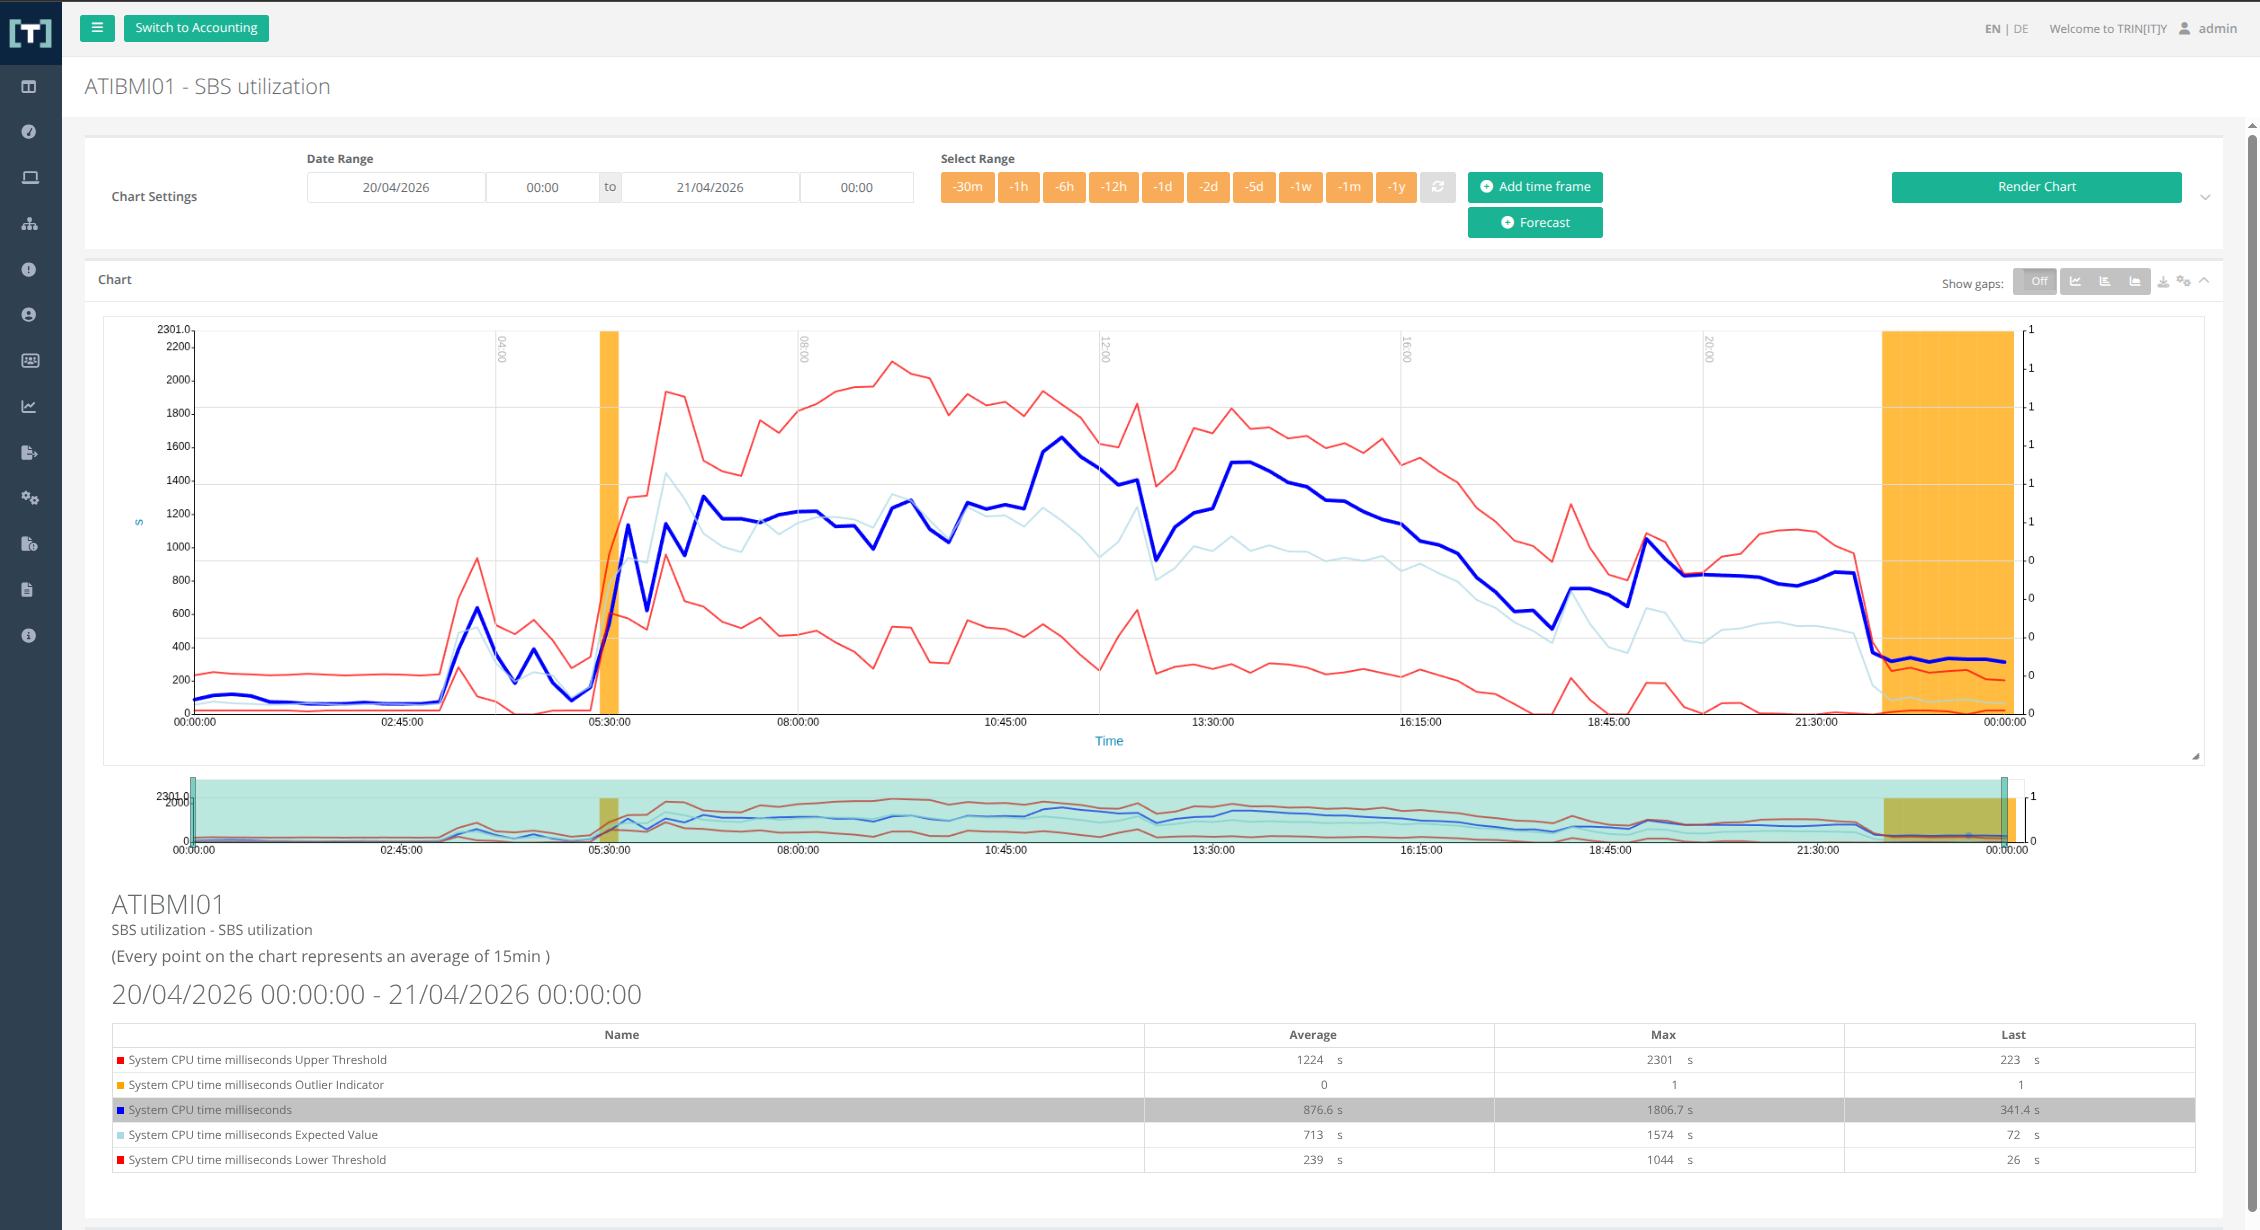
Different units, data sources, and time intervals are automatically normalized so that performance data from different systems can be directly compared on a common timeline.
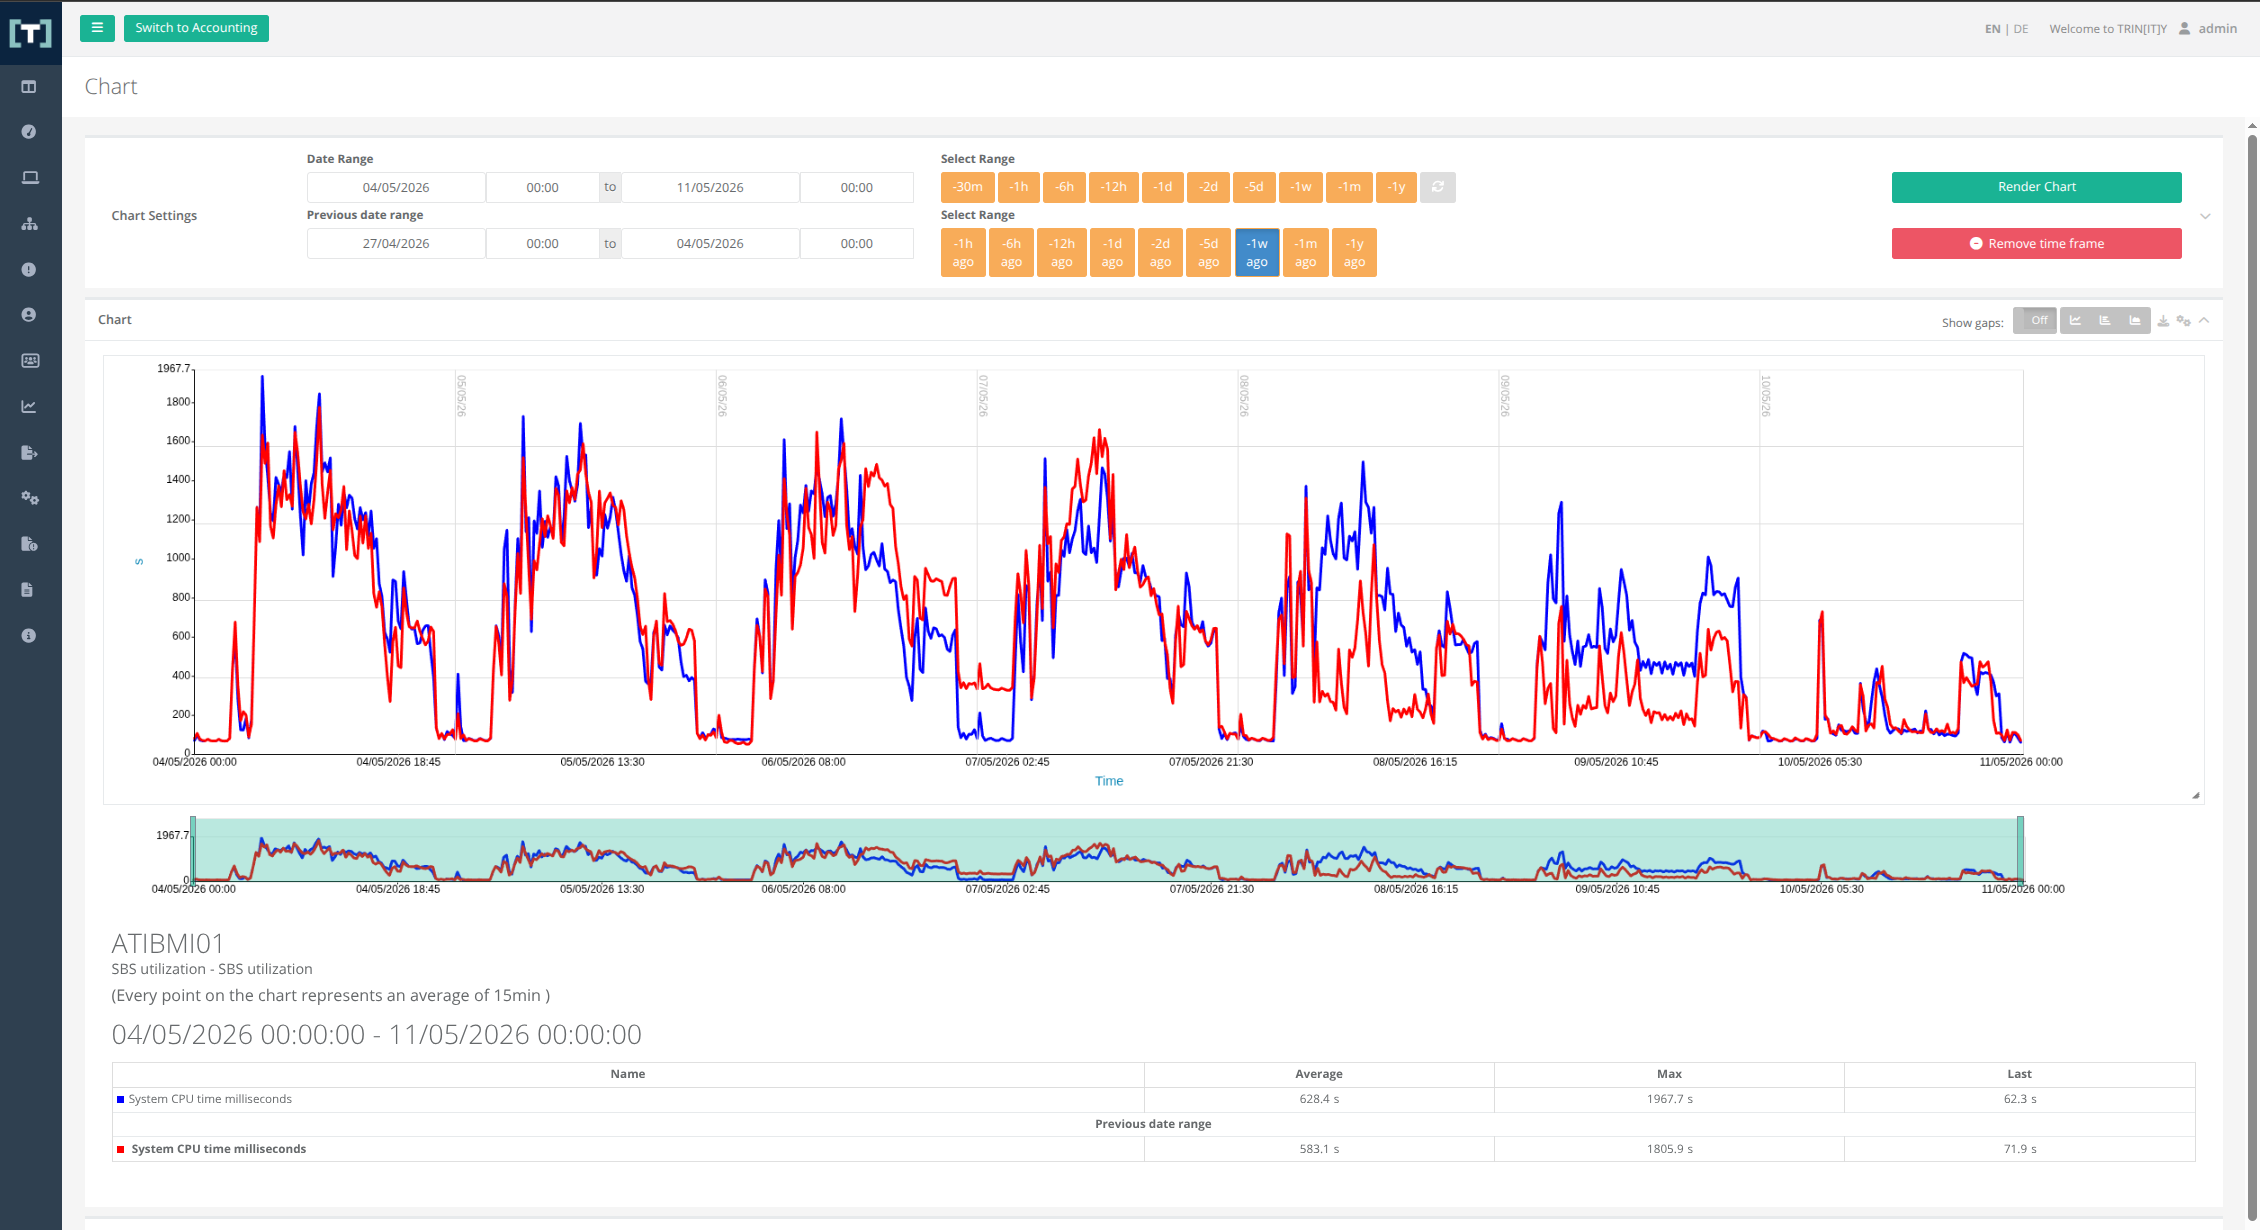
In addition, TRIN[IT]Y allows you to compare up to two different time intervals within a single graph. This makes it much easier to identify and pinpoint changes and variations over time—without having to manually consolidate data from different tools.
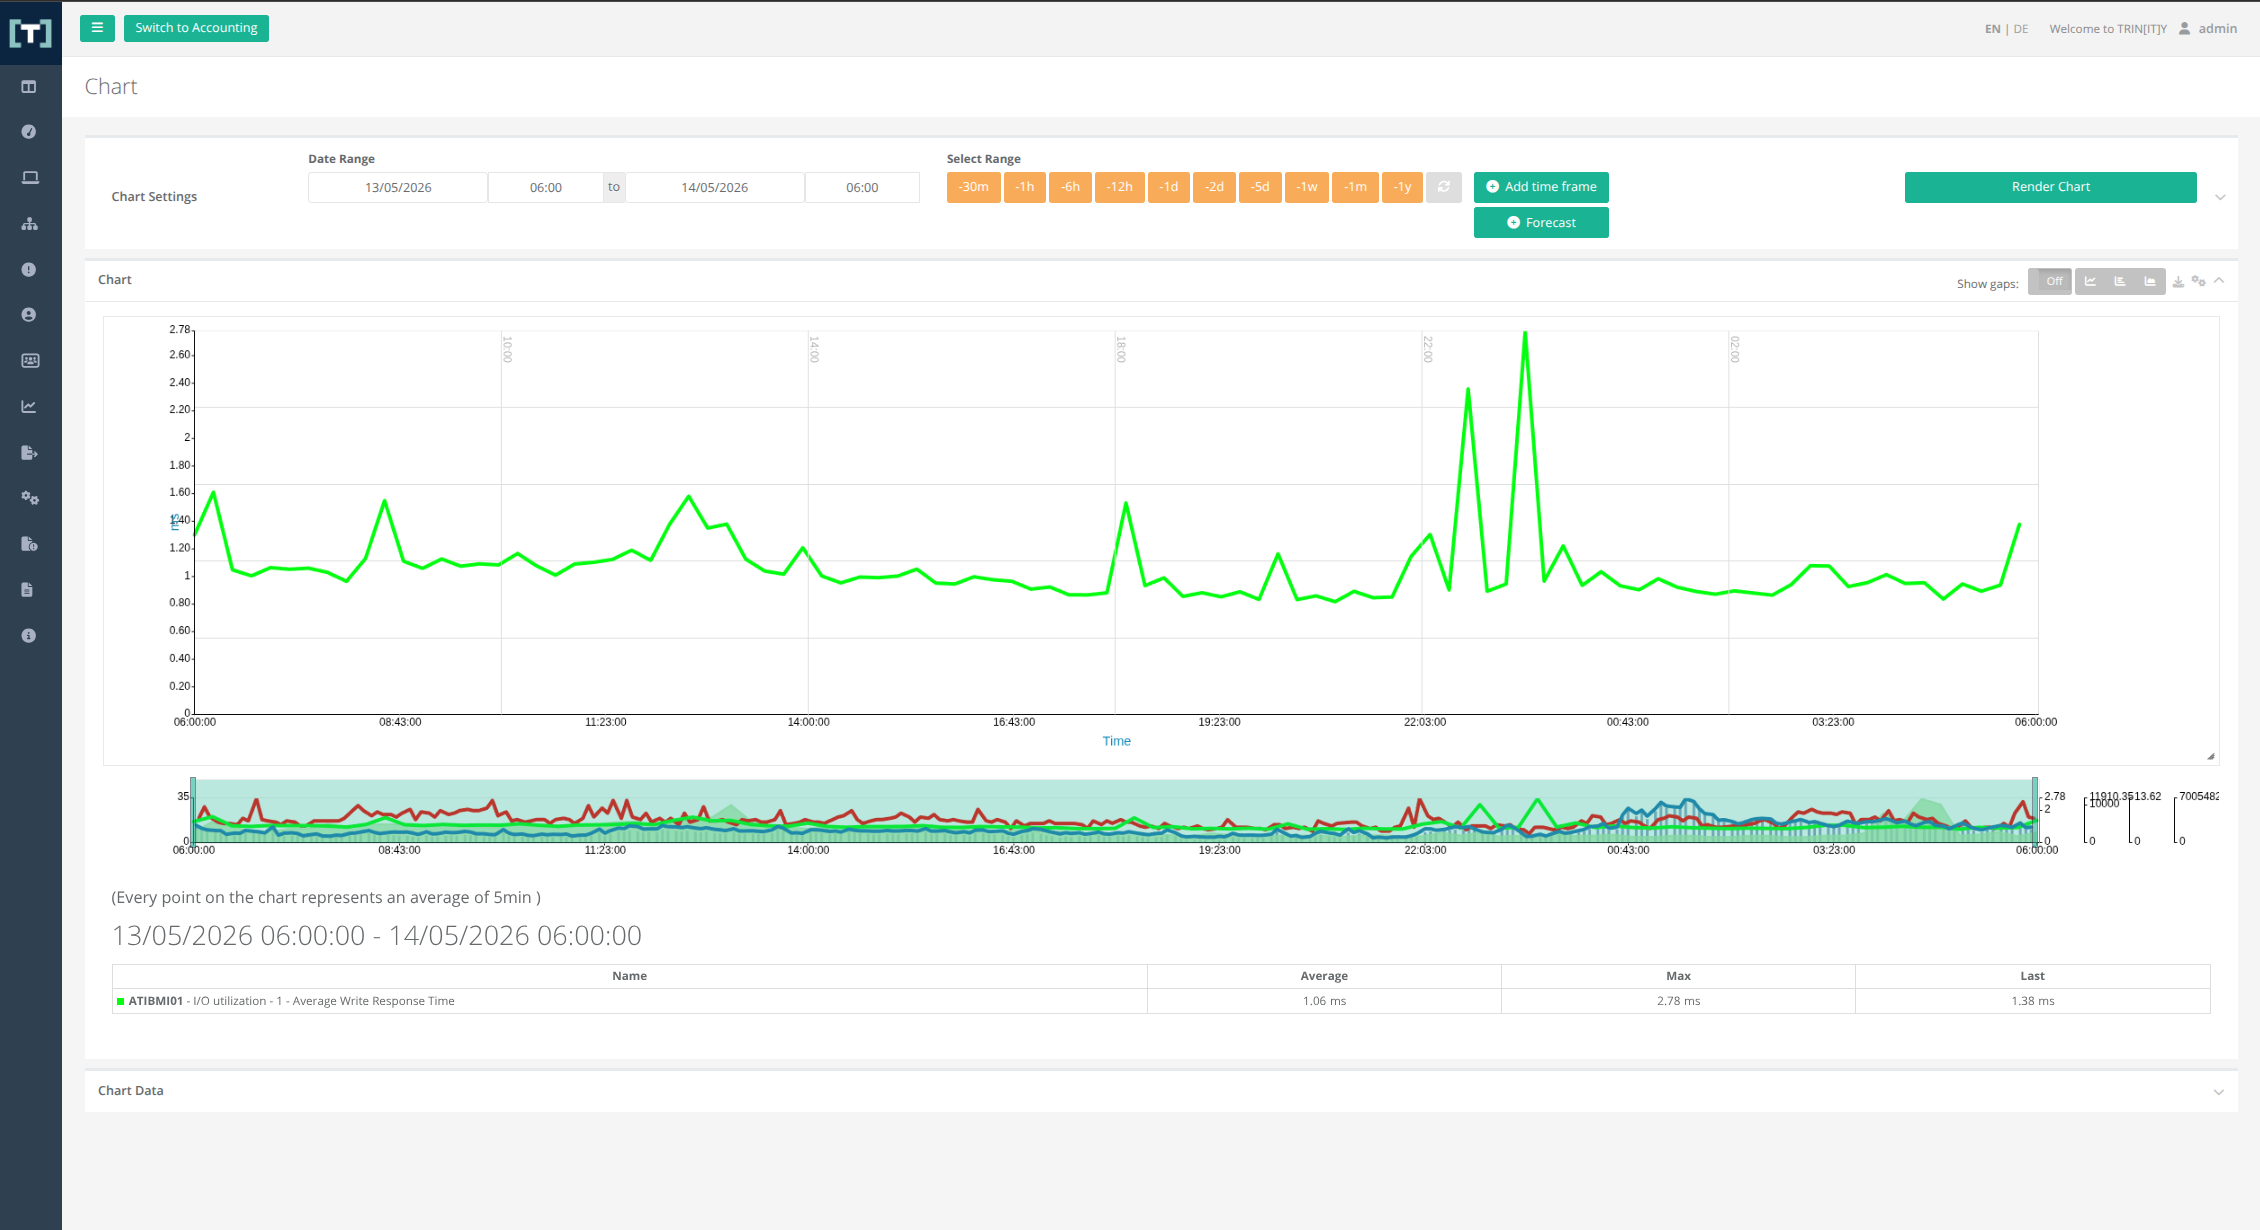
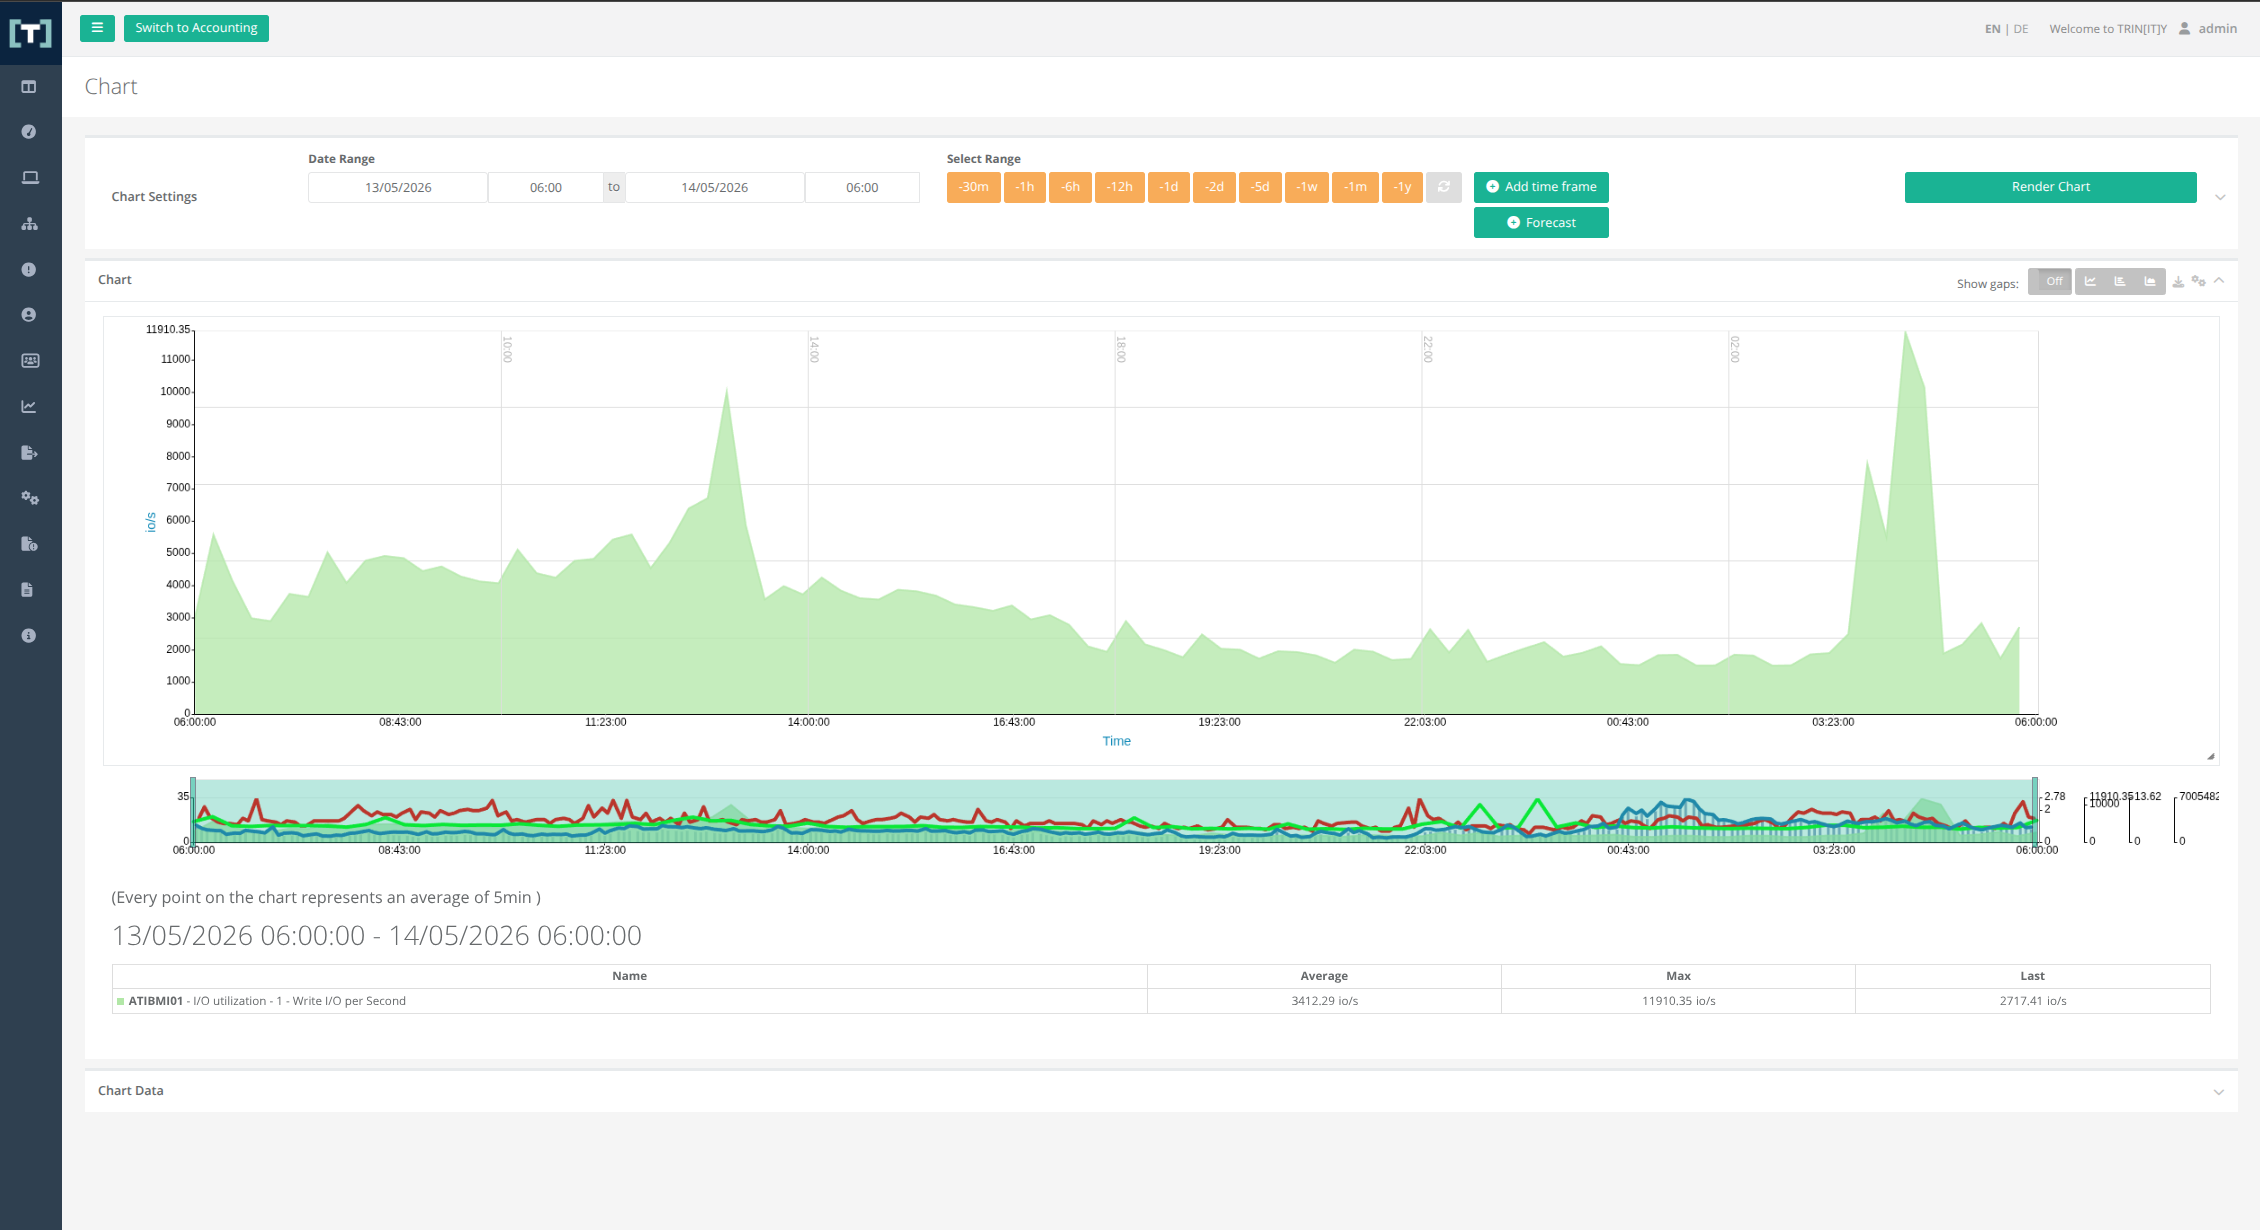
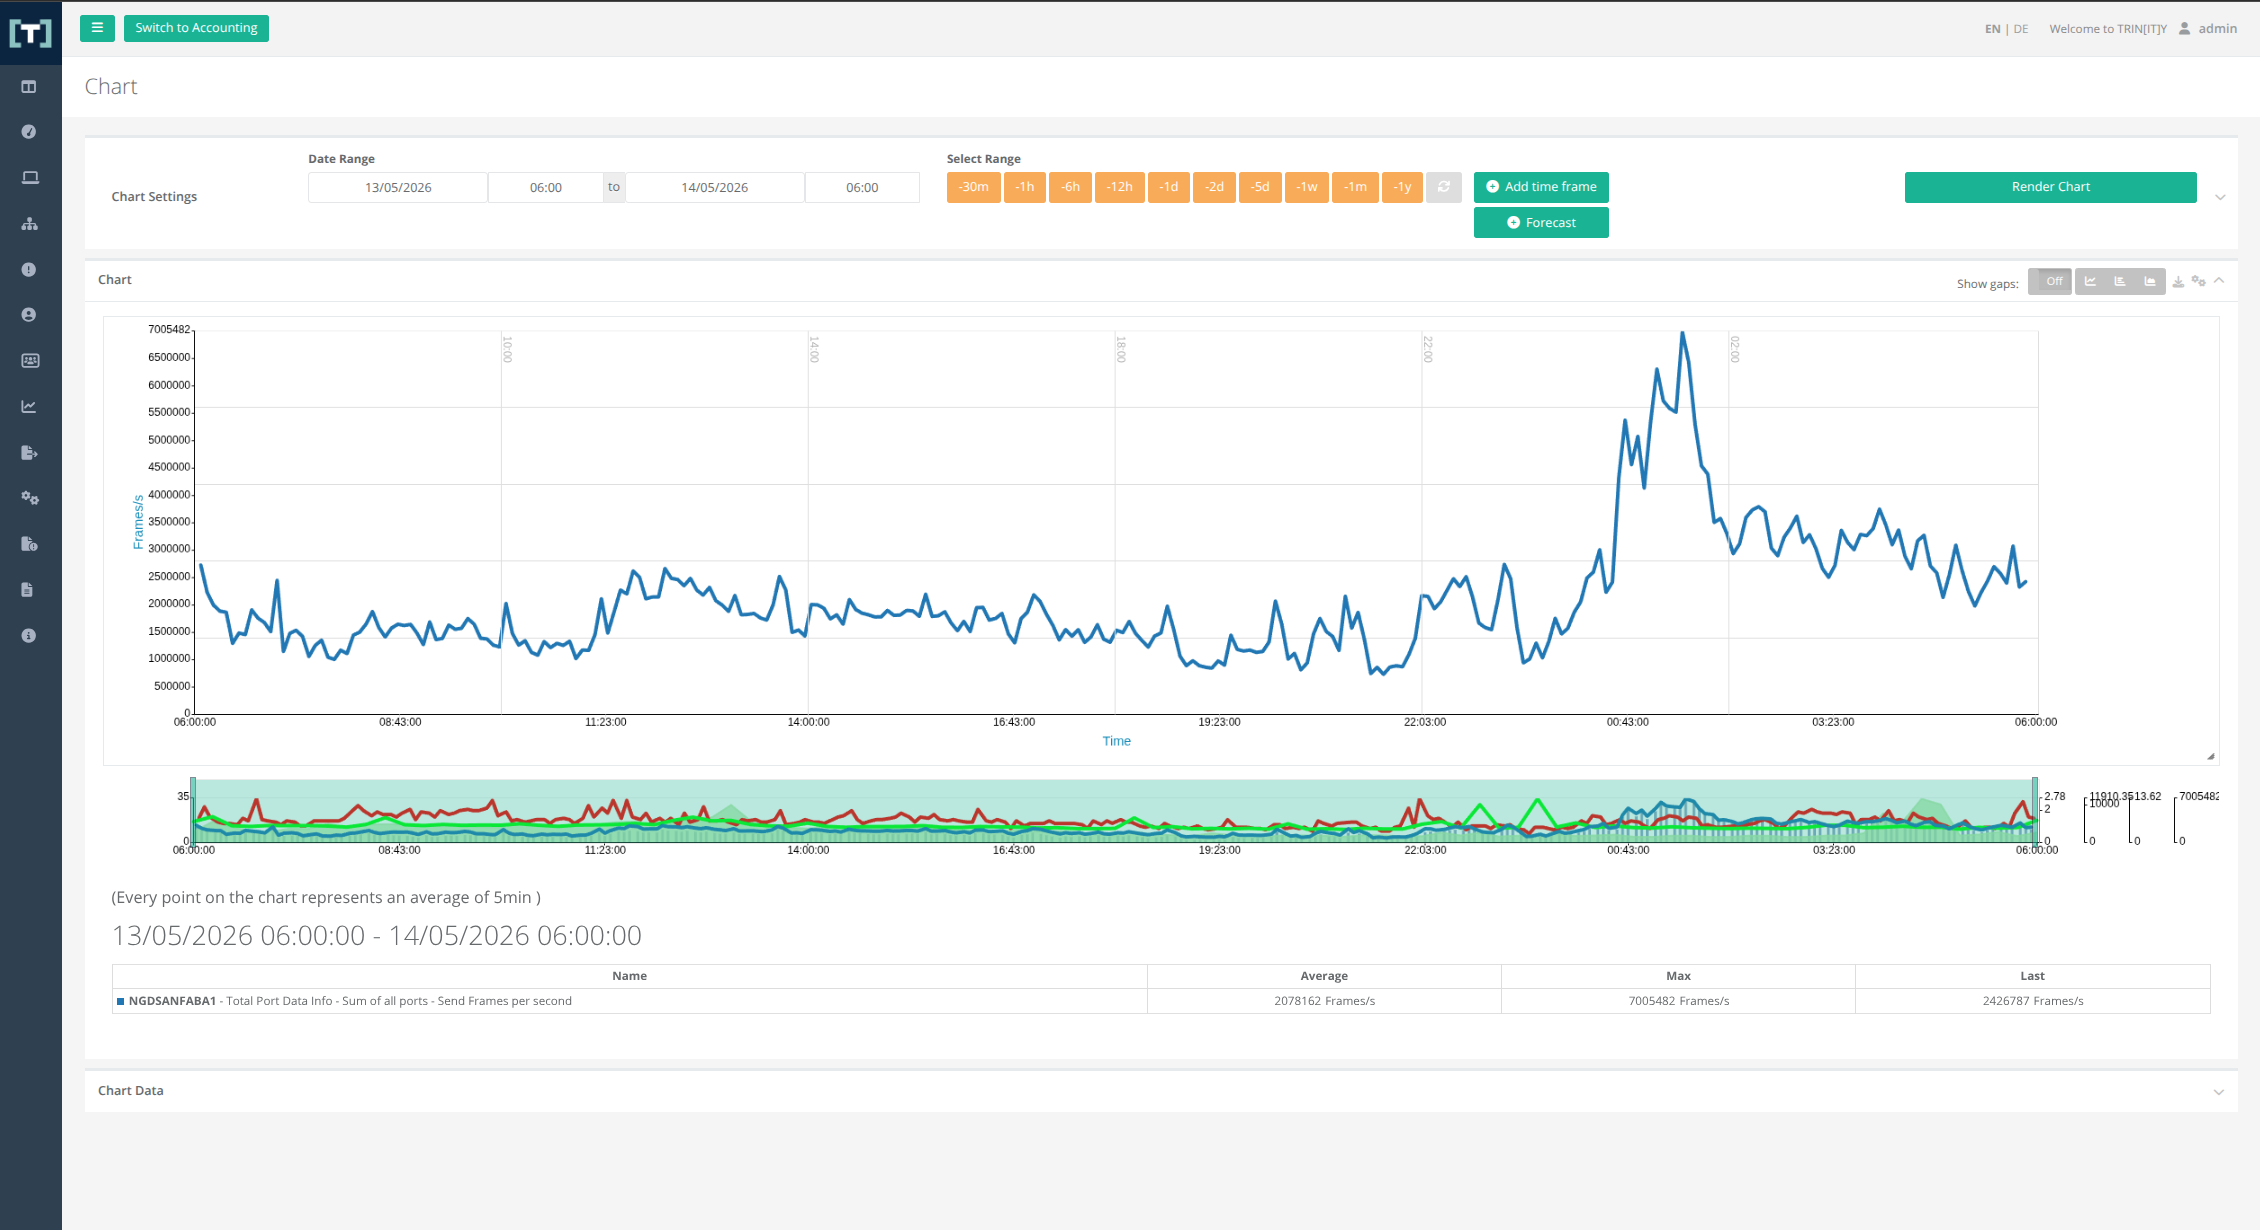
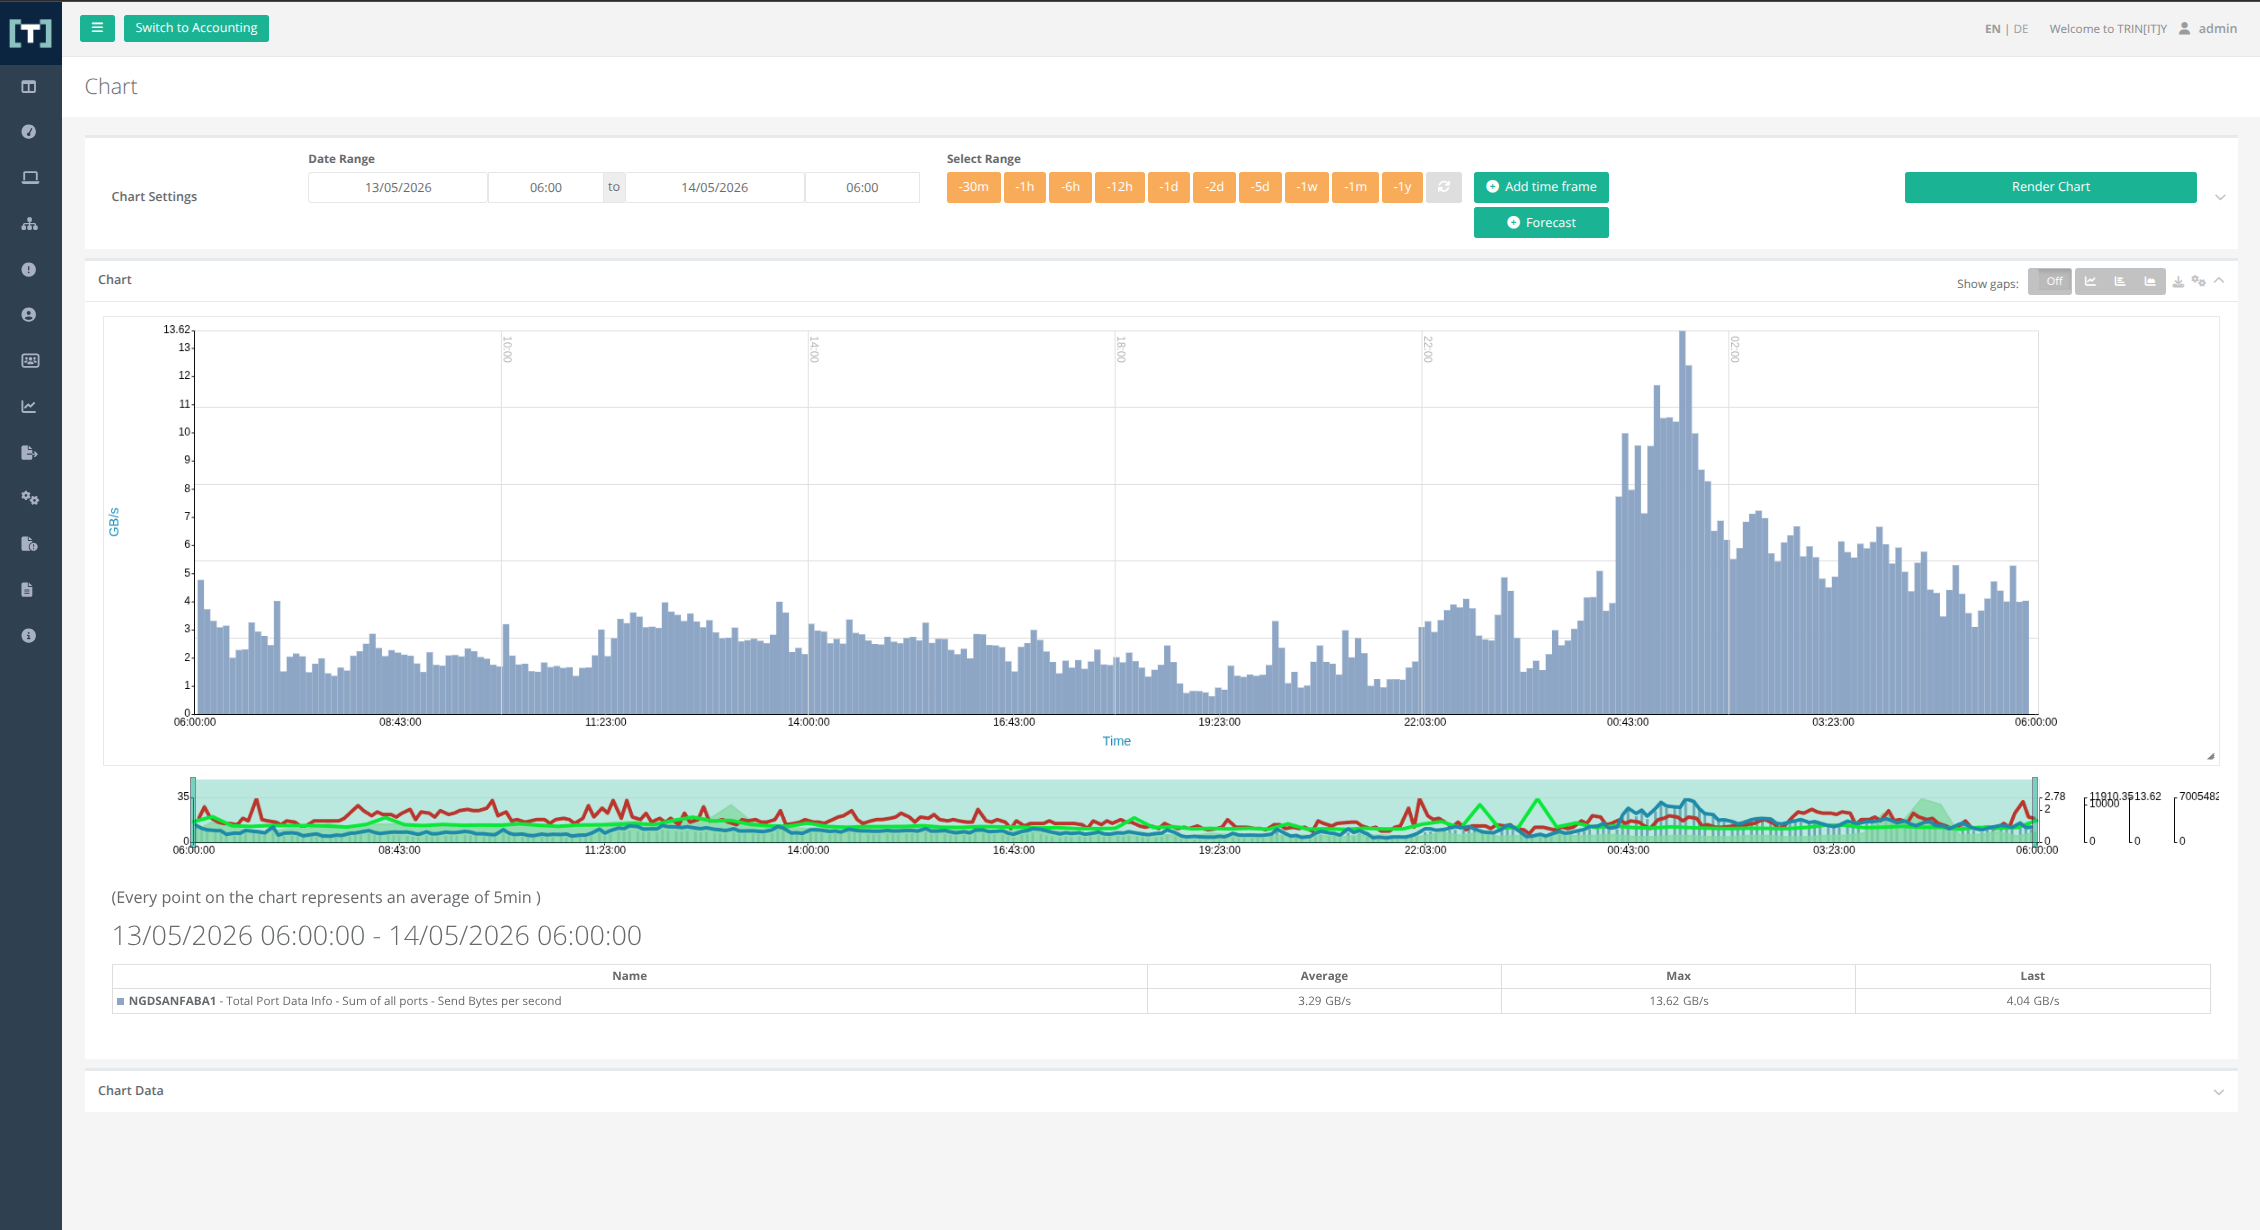
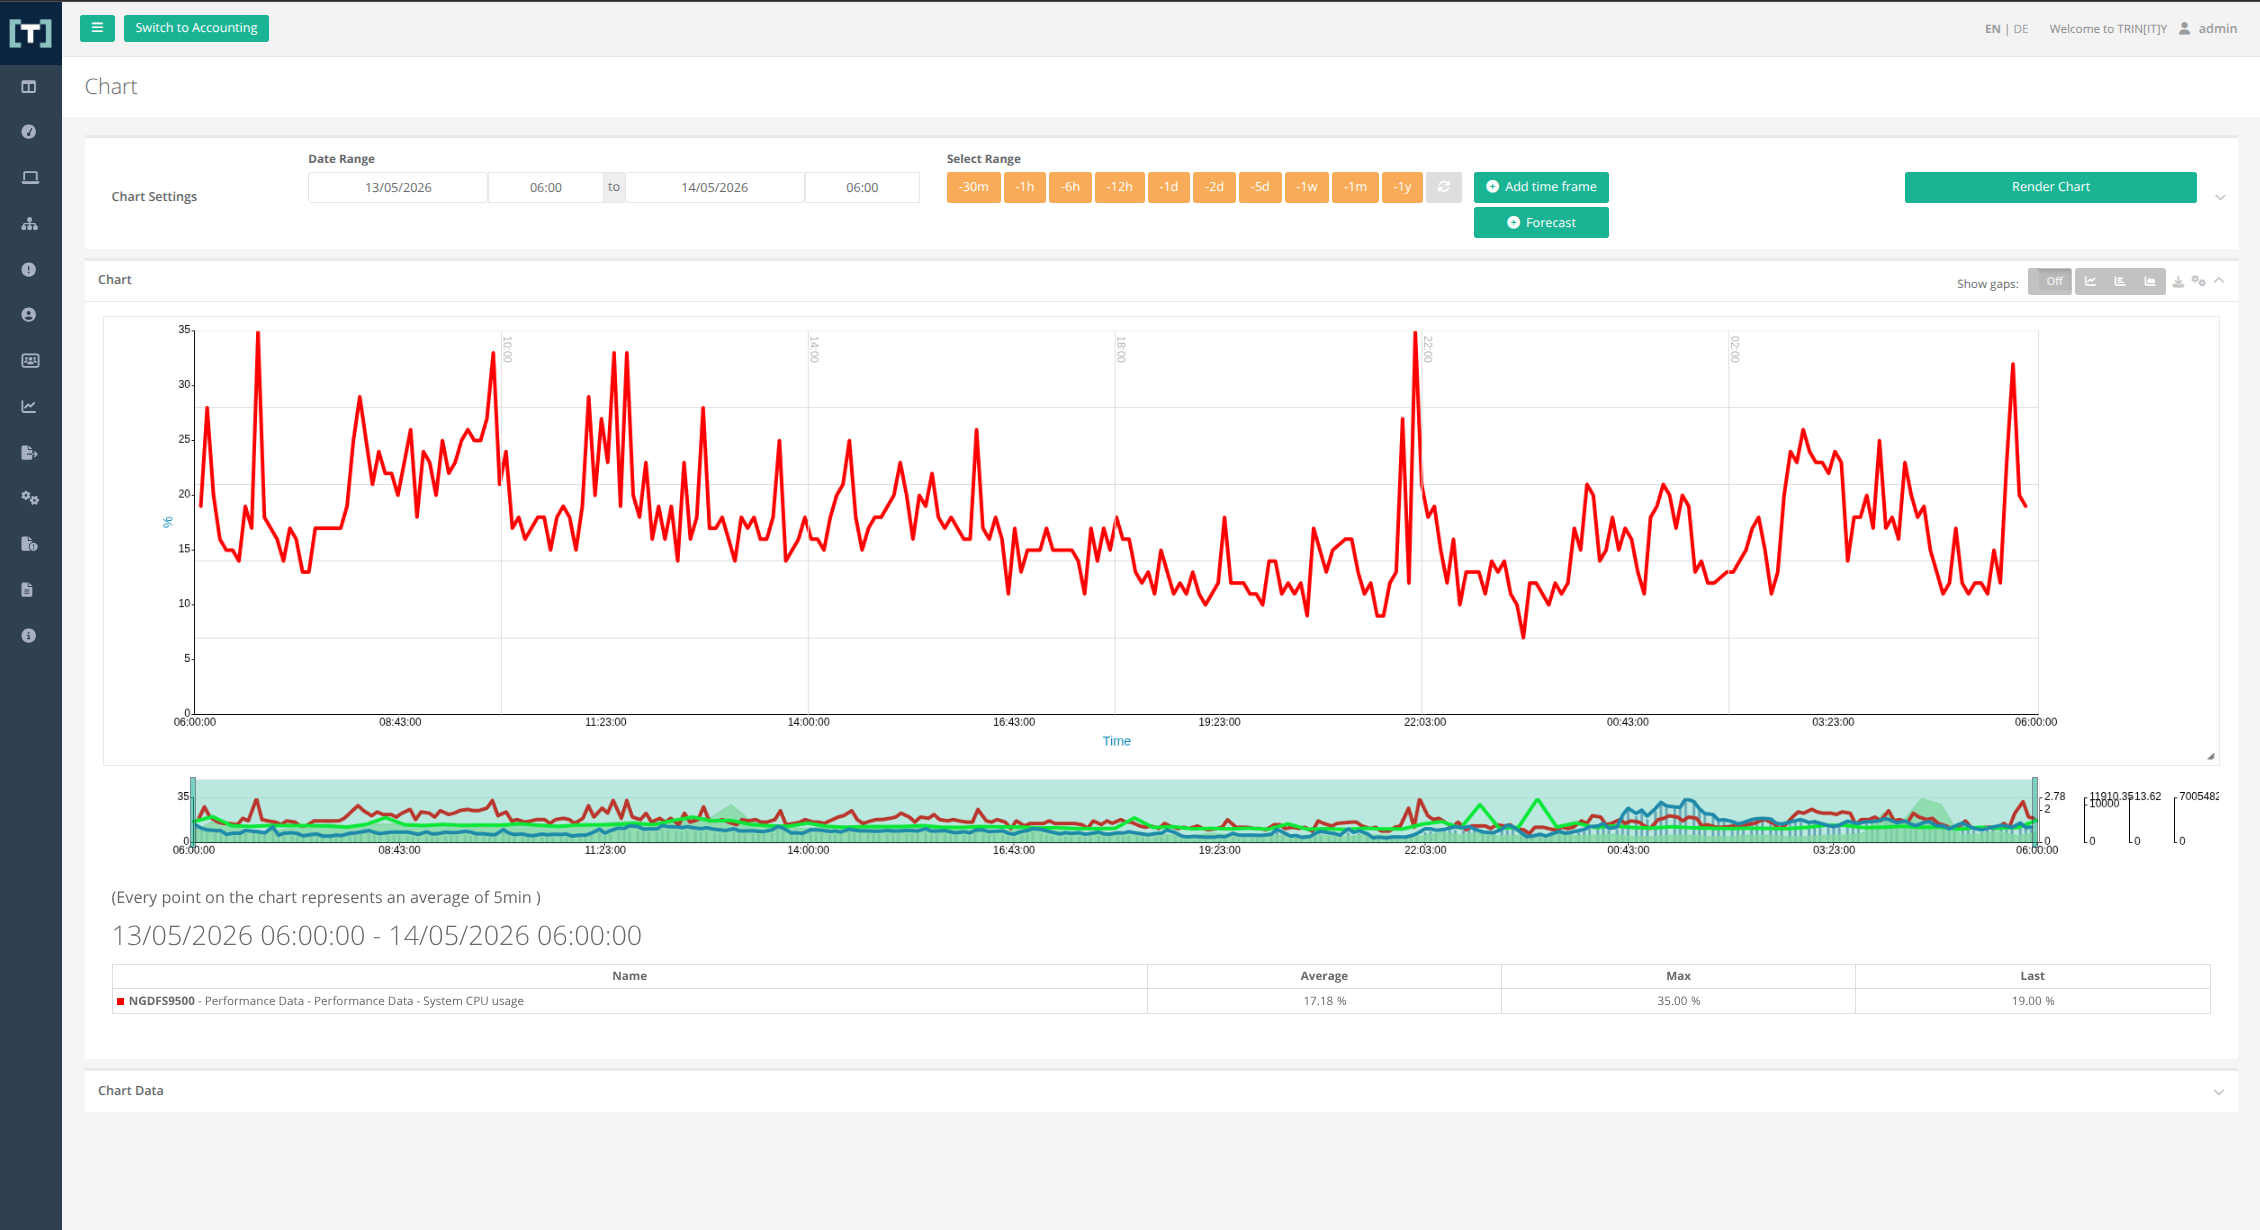
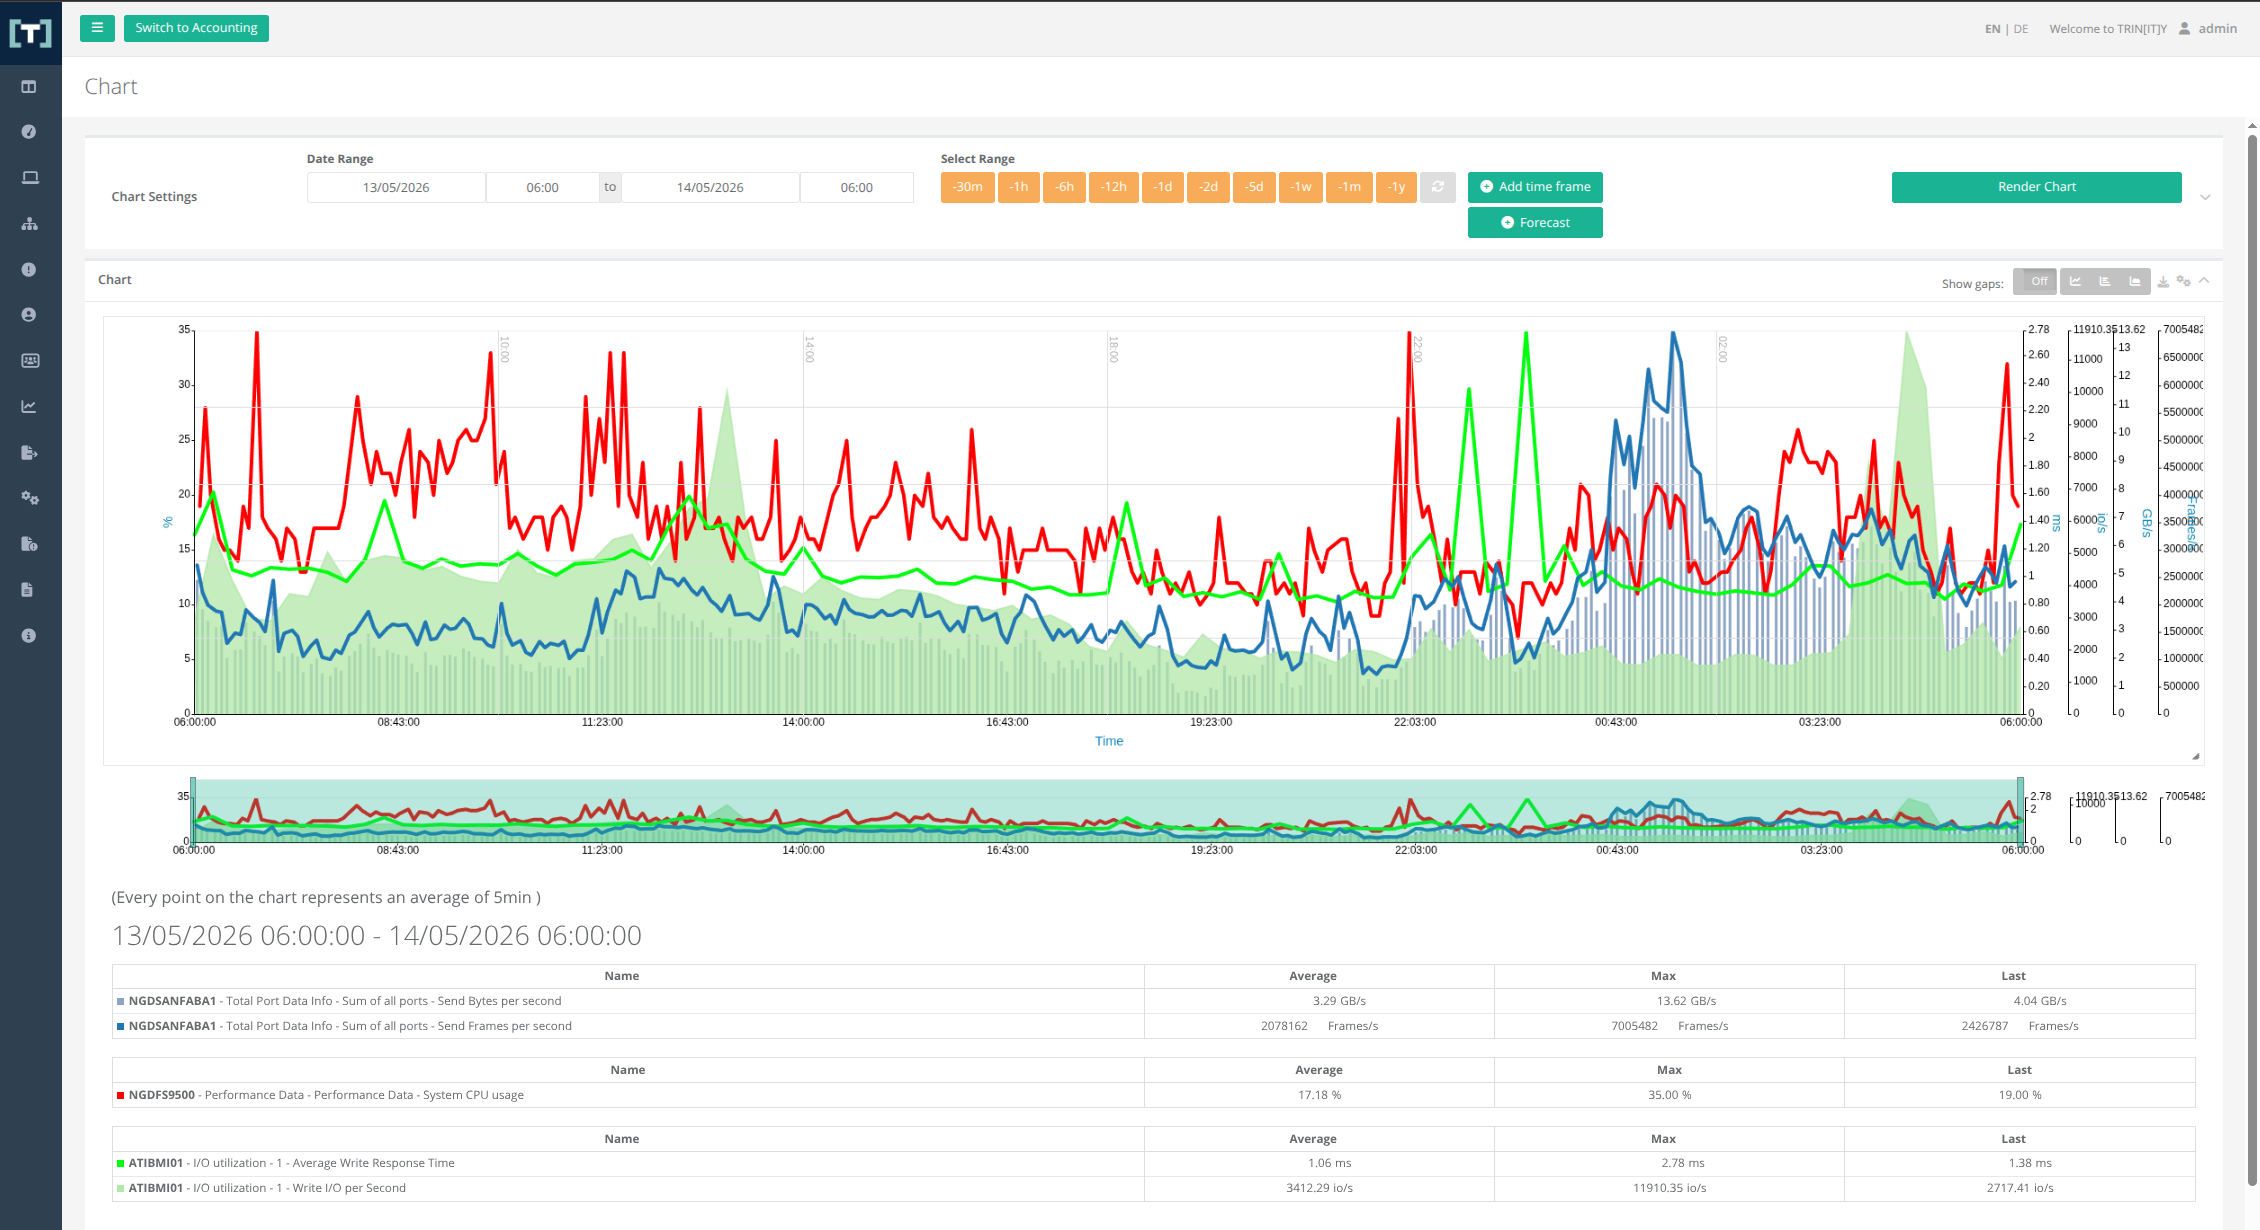
Views, displayed values, and graphical representations can be flexibly customized to meet individual requirements—including various line, bar, or area charts.
Detailed views, zoom, and mouse-over functions allow you to zoom directly into the data and analyze specific values without switching systems.
By providing a unified graphical view of infrastructure, change, and performance data, it is possible to narrow down potential causes much more quickly and significantly speed up root cause analyses.
By using InfluxDB, historical data spanning many years can be stored and searched efficiently—even in large-scale deployments—while minimizing storage requirements and maintaining high performance—with up to 20 times less storage space needed. This makes it possible to track infrastructure changes and their long-term effects, and to analyze the causes of errors much more quickly.
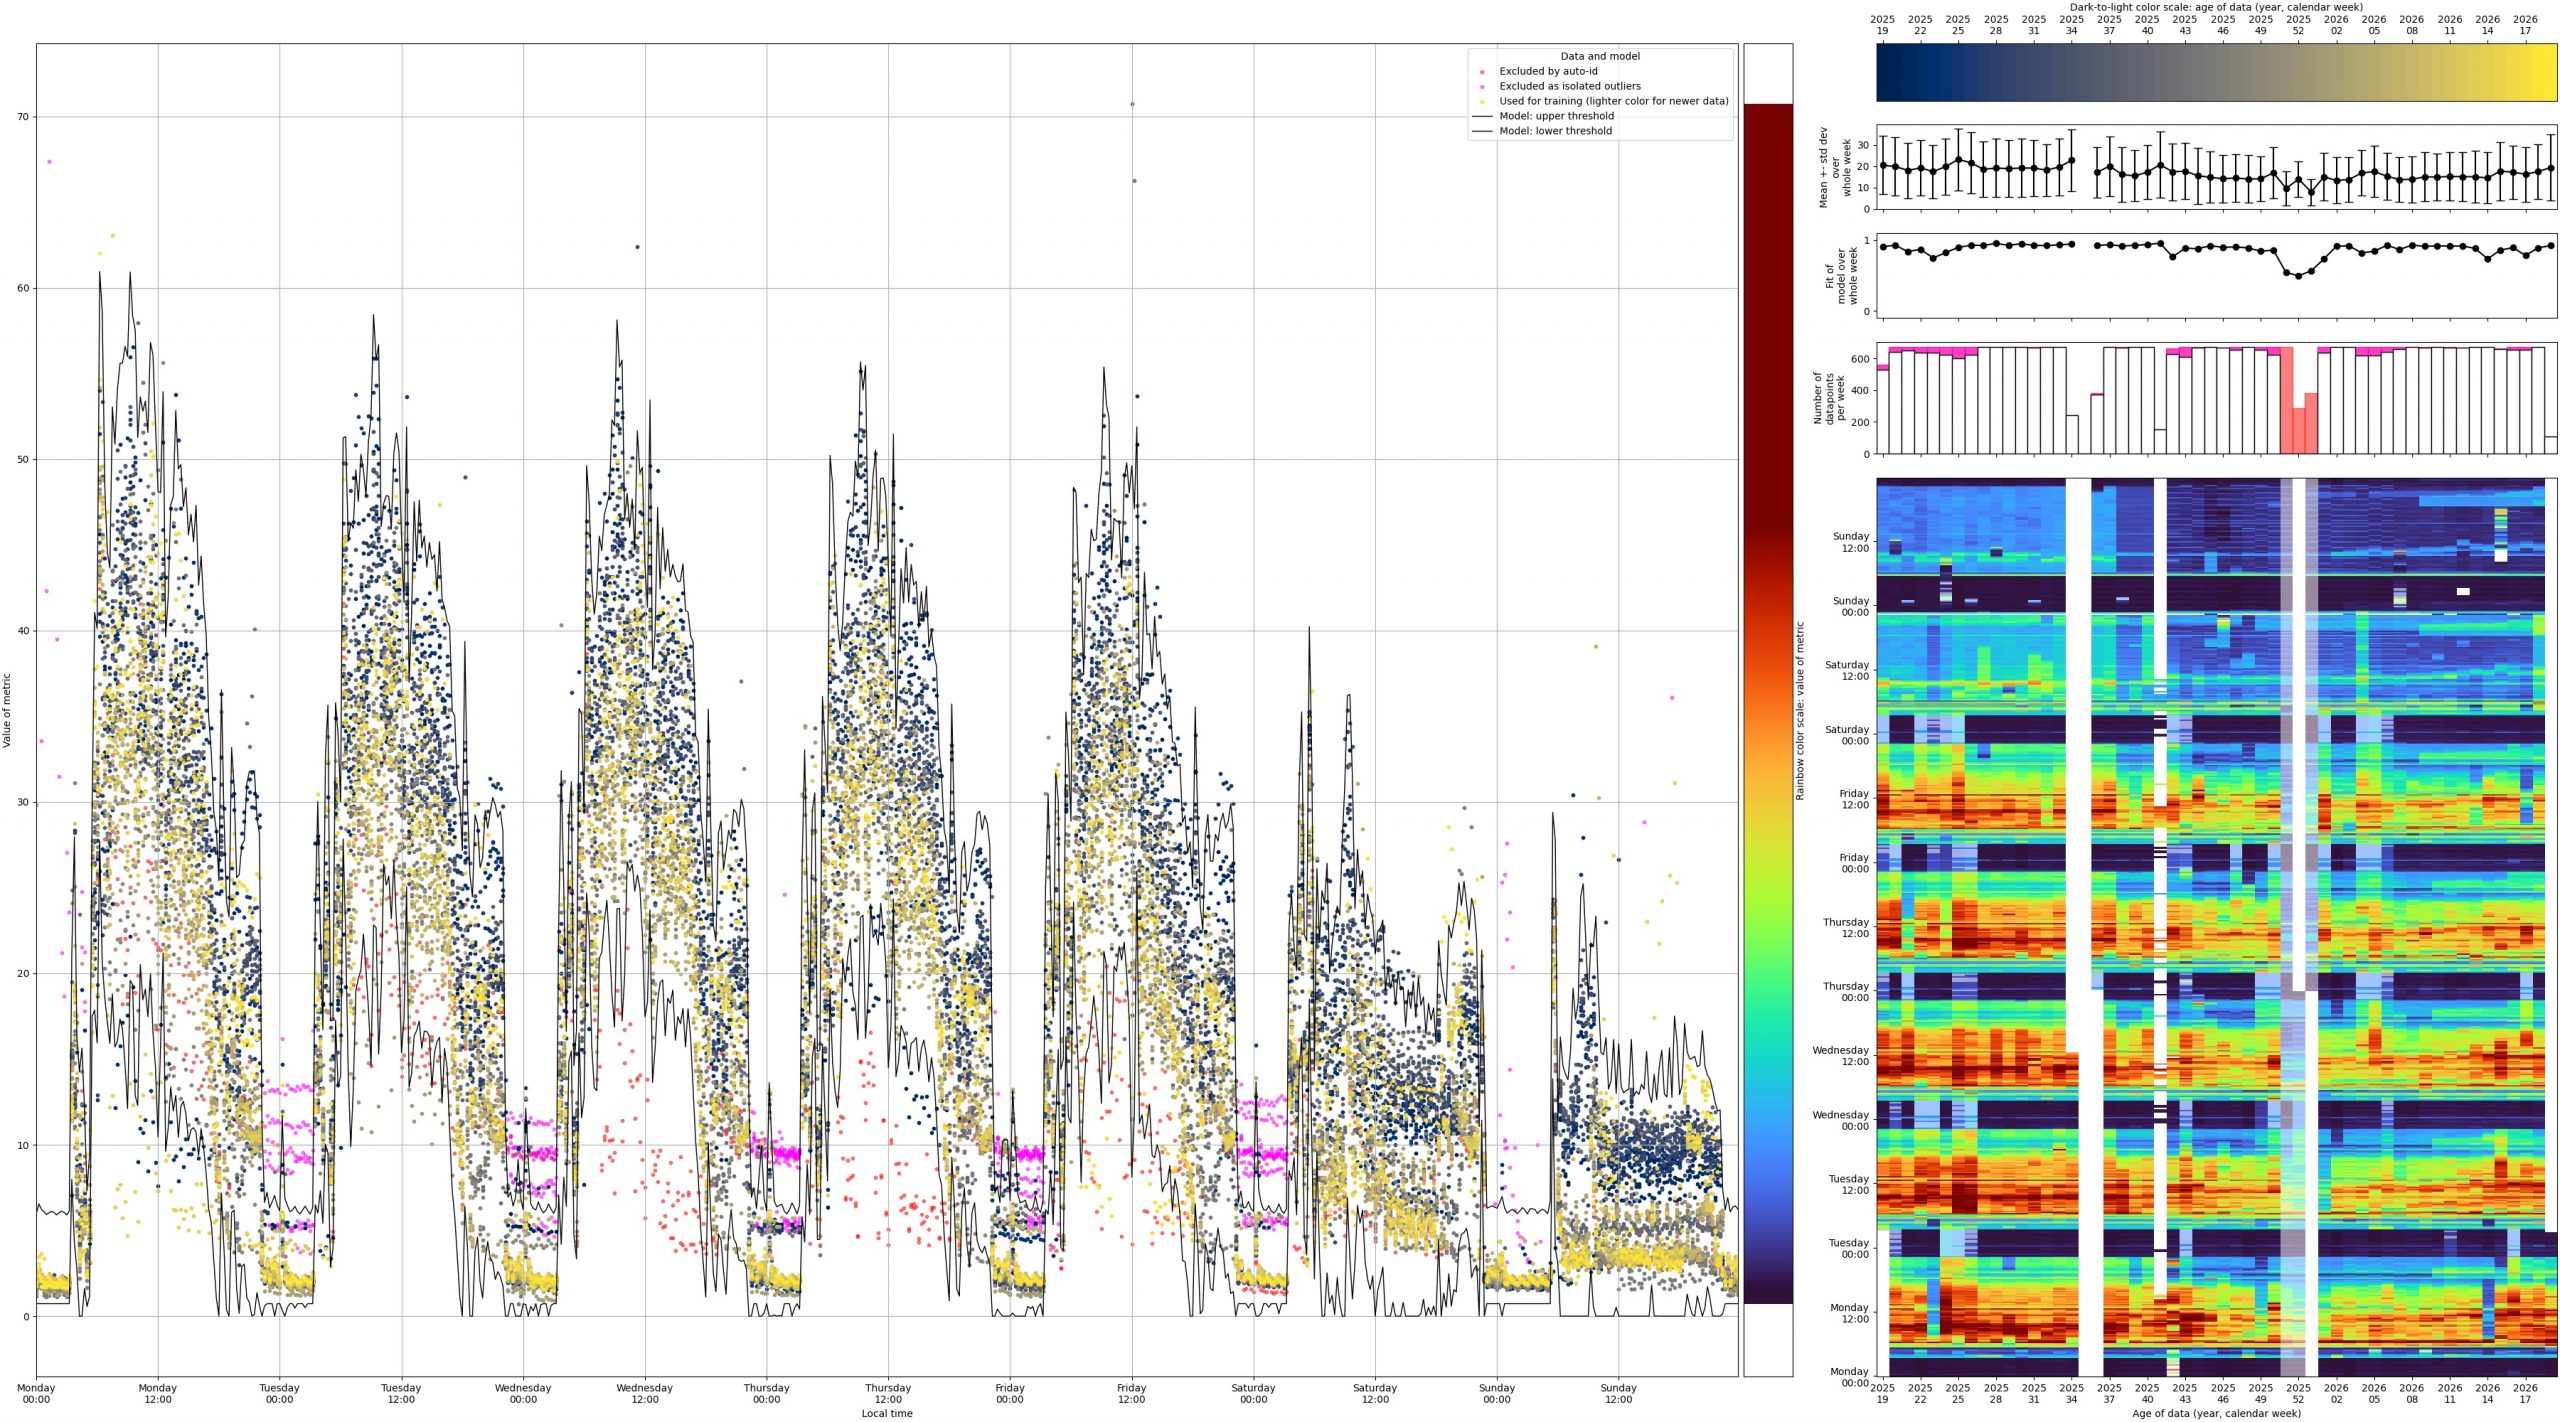
Traditional monitoring tools usually only respond once a problem has already occurred. TRIN[IT]Y, on the other hand, detects anomalies and unusual trends early on based on historical data and automatically learned system behavior using Predictive Smart Alerting.
Customizable thresholds help identify critical changes (whether above or below the threshold) at an early stage—before they lead to noticeable performance issues or outages.
Automatic notifications can be sent specifically to designated users or teams. Additionally, time windows and exception periods can be taken into account—for example, for scheduled maintenance or regular post-processing.
Would you like to see how predictive alerting and root cause analysis work in practice?
We’ll demonstrate TRIN[IT]Y live using typical IT infrastructure and performance scenarios.
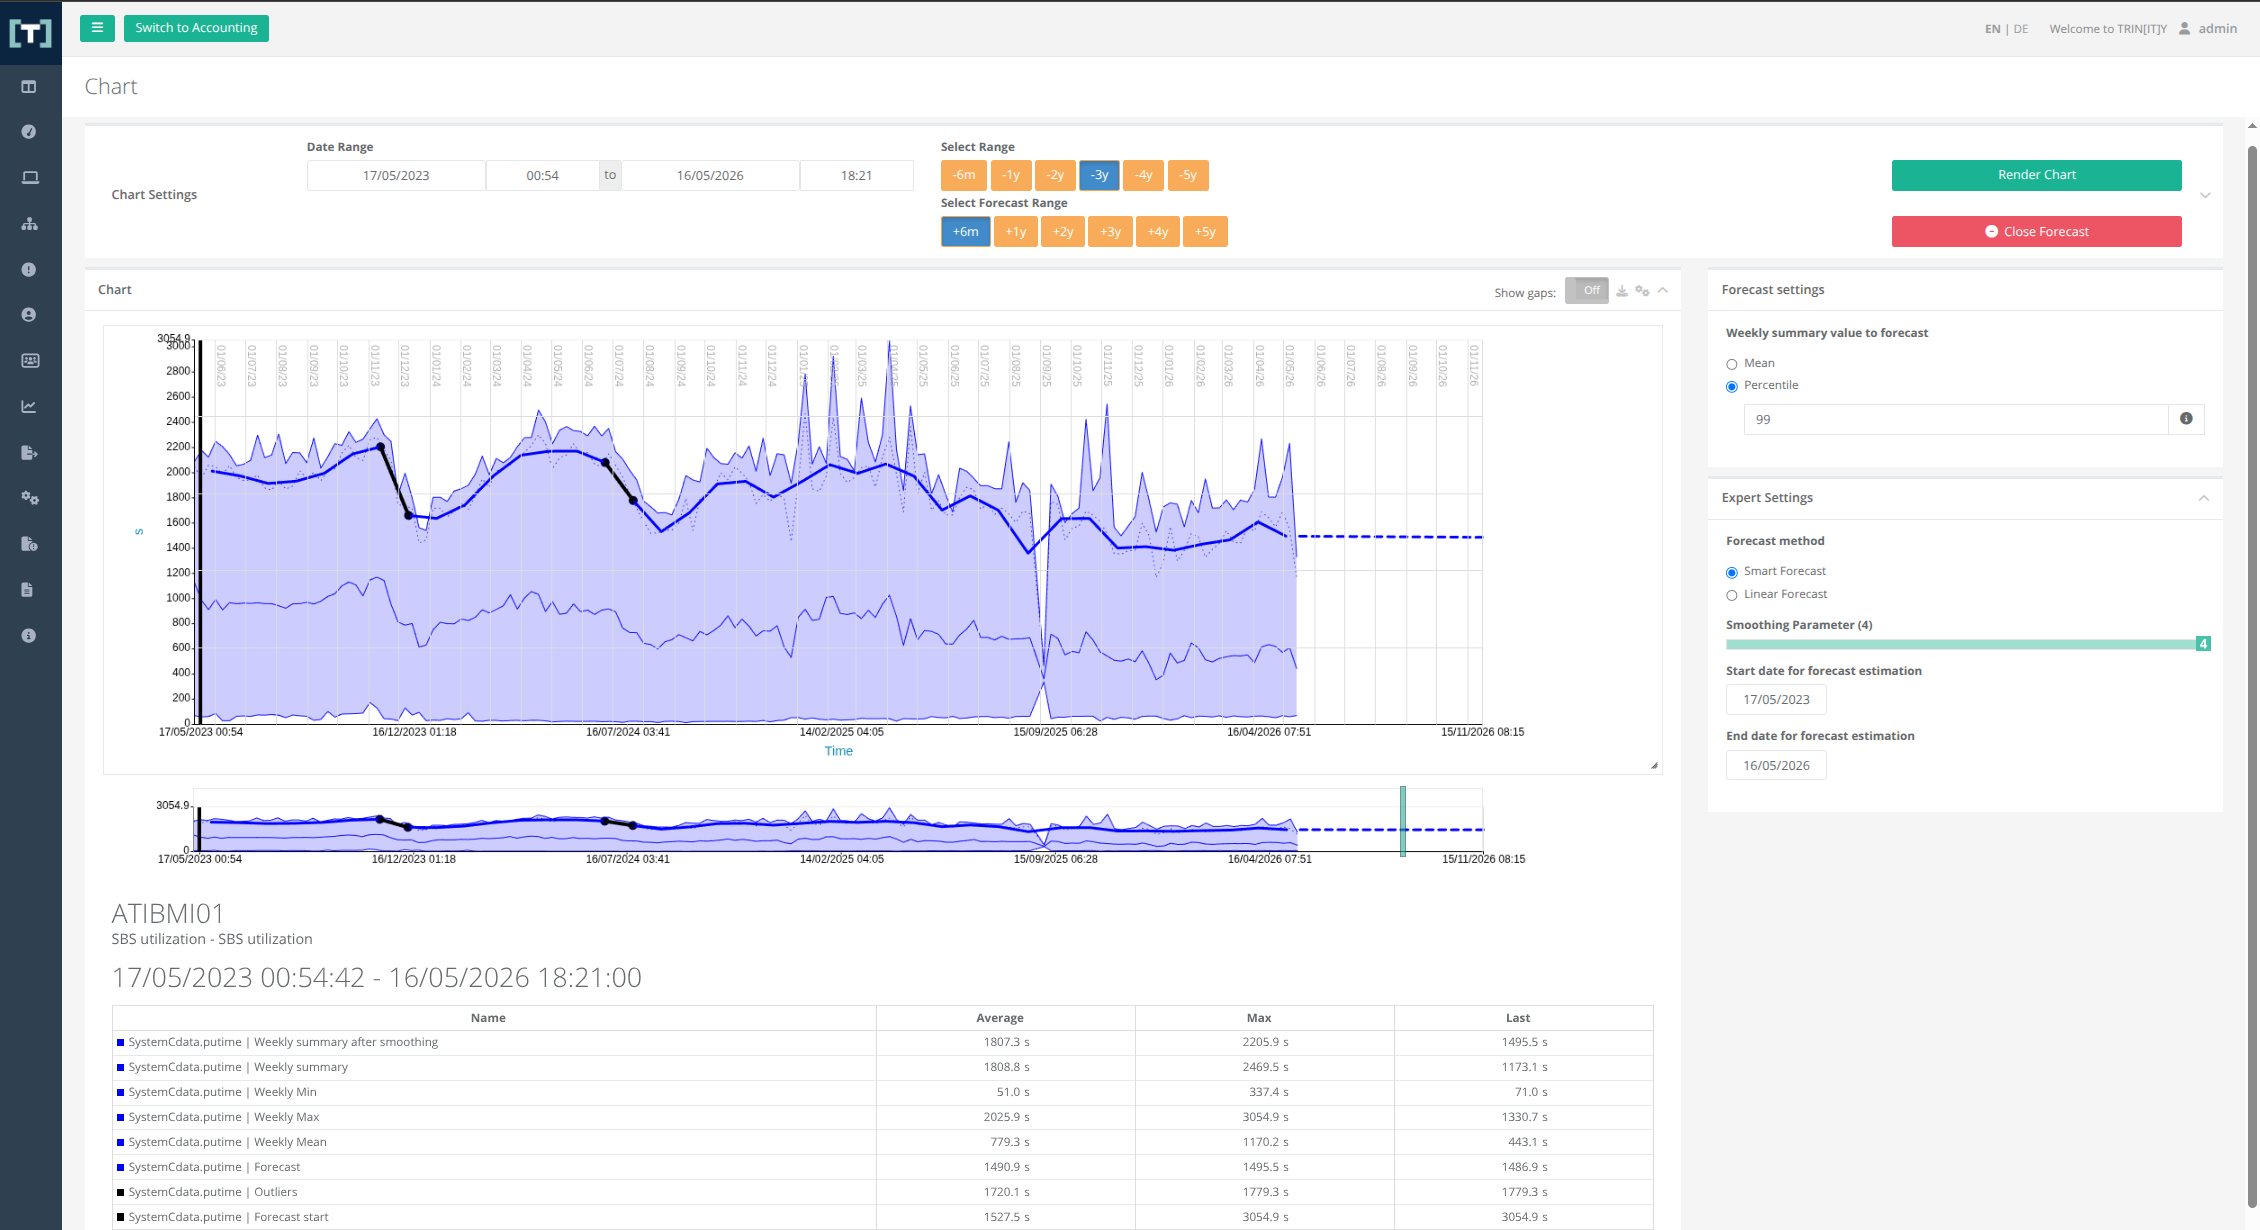
Increasing workloads, changing usage patterns, or creeping bottlenecks often only become apparent once systems have already reached their limits. Without long-term analysis, such developments in complex IT infrastructures often go unnoticed for a long time.
Using the Long-Term Forecast, TRIN[IT]Y analyzes historical trends, identifies patterns, and forecasts future utilization rates and capacity trends well in advance. This makes critical bottlenecks visible before they disrupt ongoing operations.
Based on historical analyses and long-term trends, investments, capacity expansions, and optimizations can be planned more effectively. At the same time, it becomes clear what impact migrations, infrastructure changes, or new systems actually have on utilization and resource consumption.
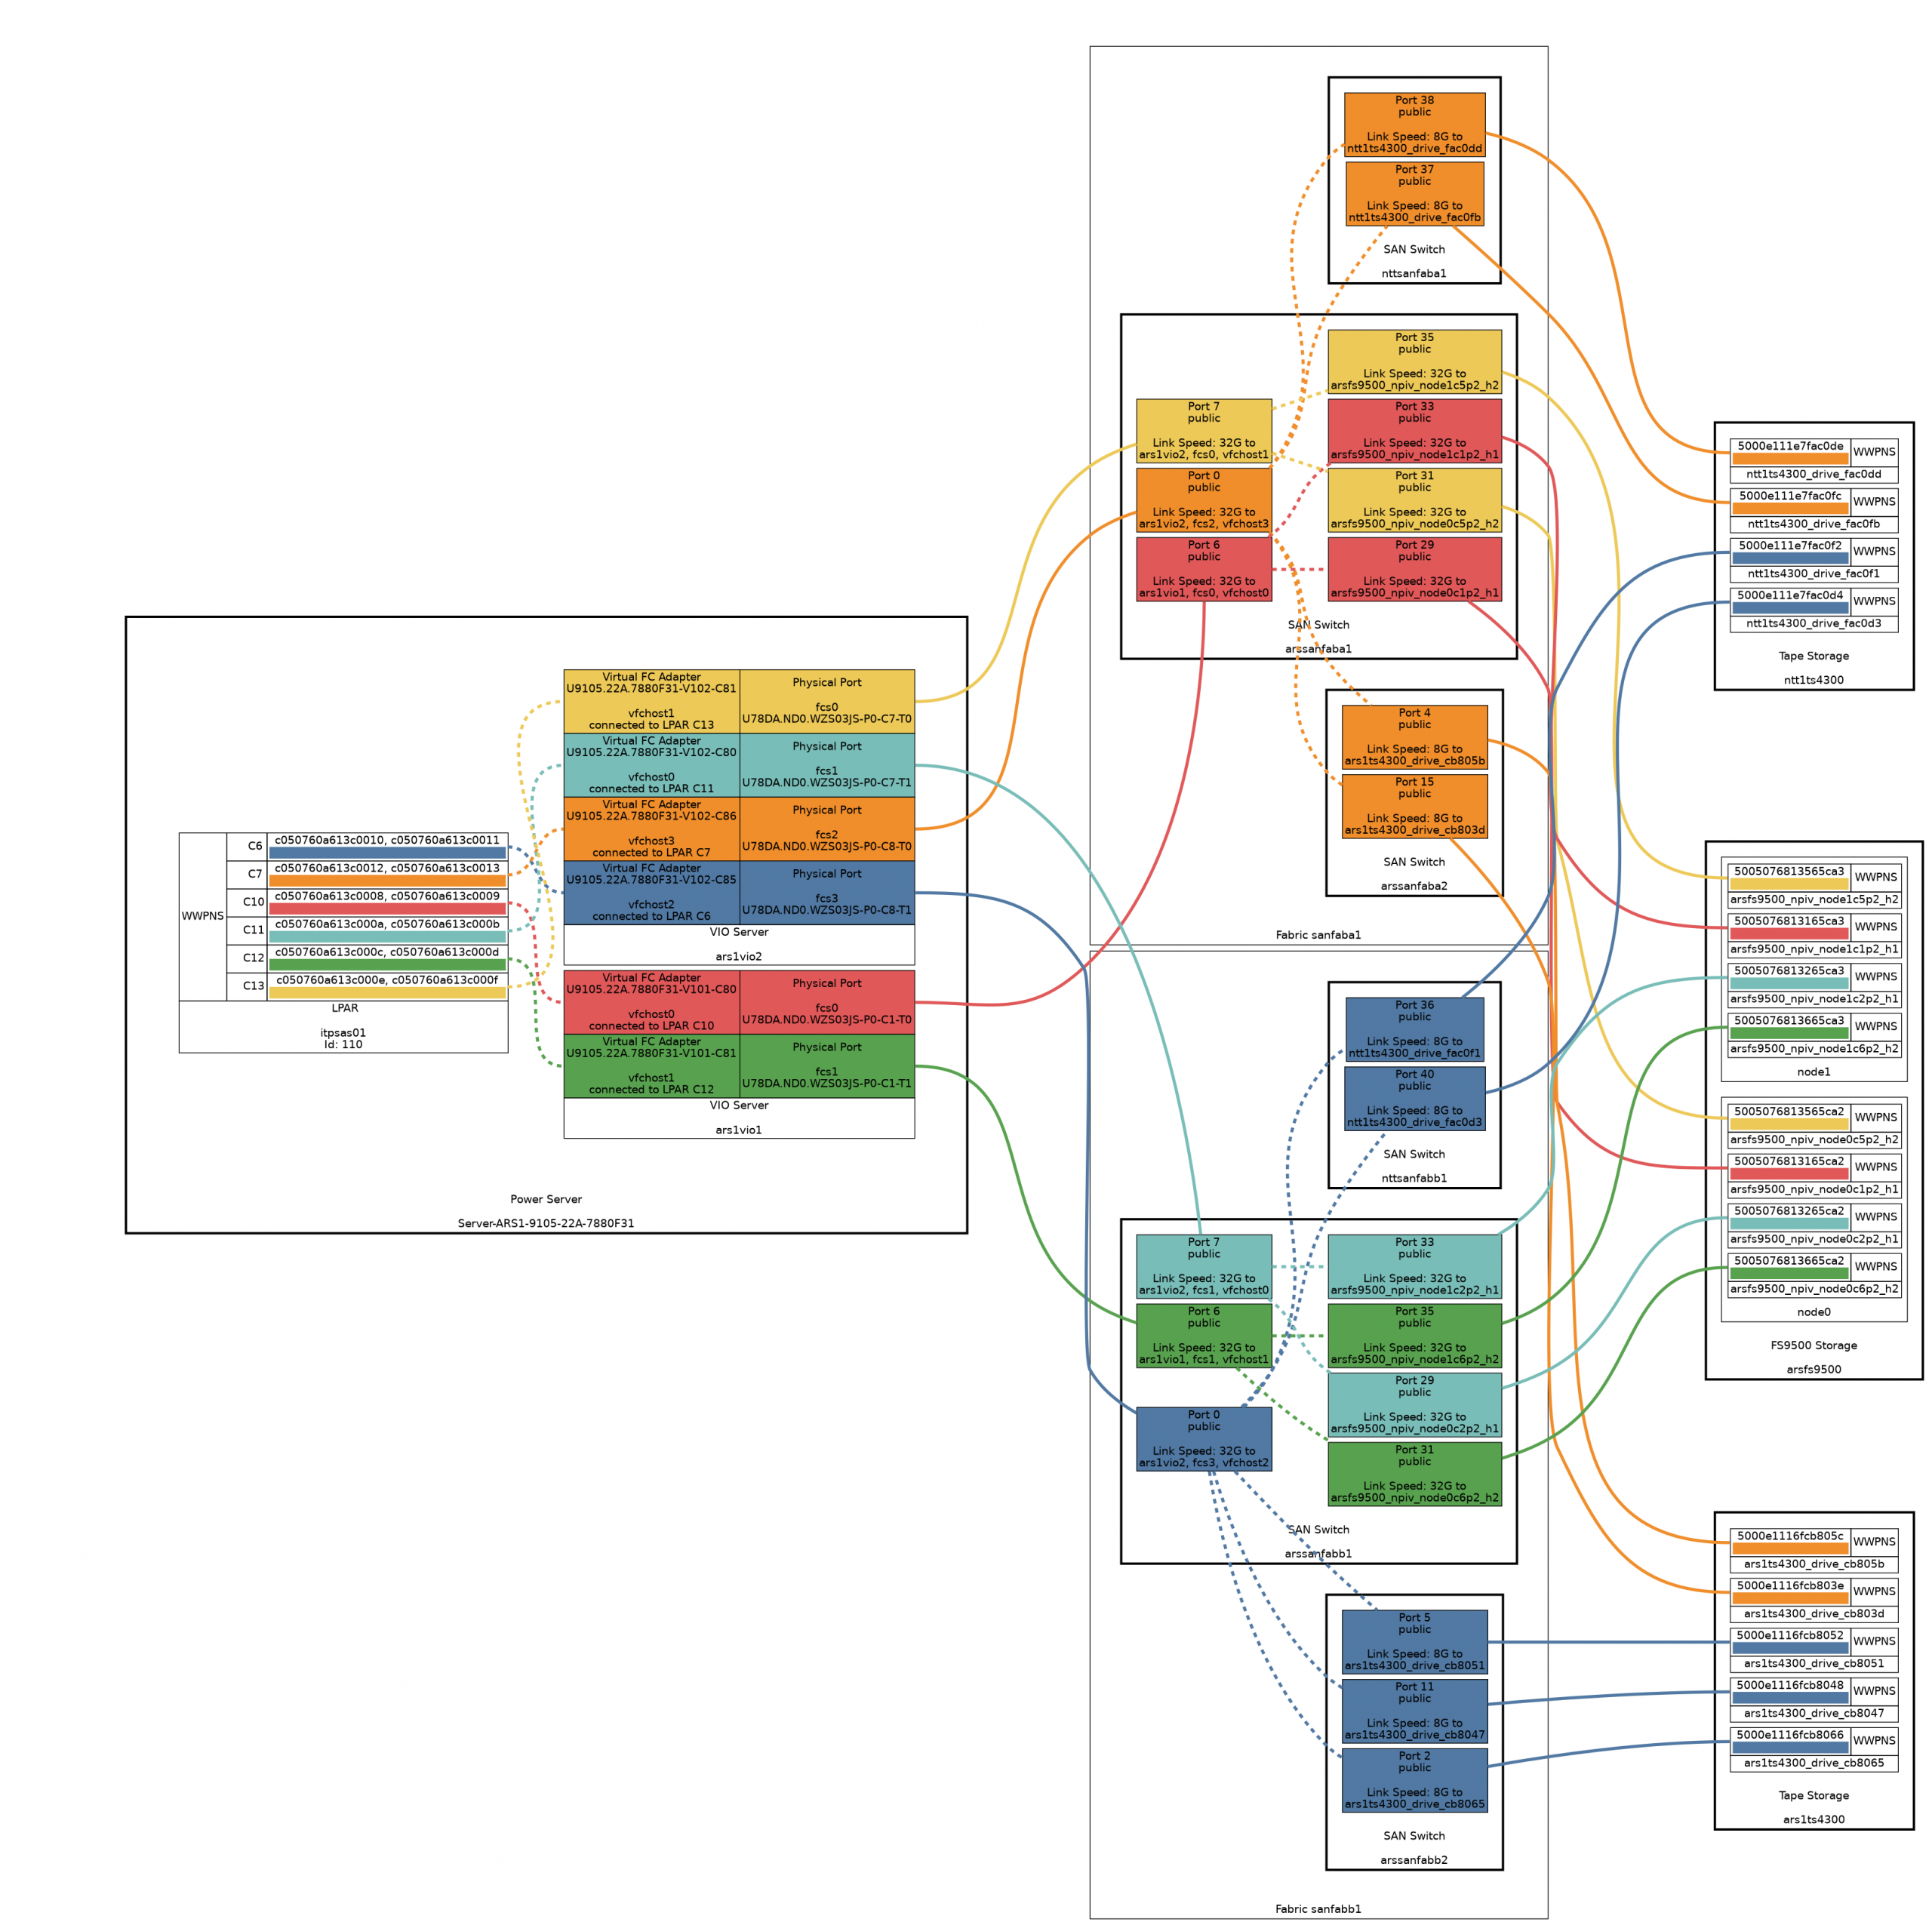
TRIN[IT]Y automatically generates a graphical end-to-end representation of SAN, storage, and system connections based on the actual infrastructure configuration. This provides a clear overview of dependencies, redundancies, and physical cabling.
In addition to the performance data collected at short intervals, TRIN[IT]Y retrieves configuration information for the entire infrastructure on a daily basis and stores it centrally. This ensures that changes and infrastructure statuses remain traceable over the long term and can be analyzed for comparison, analysis, and documentation purposes.
Many solutions create additional operational overhead due to agents, complex implementations, or time-consuming maintenance. TRIN[IT]Y operates entirely agentless and can be quickly integrated into existing IT infrastructures—without the need to install additional software on production systems.
Users can be restricted to specific systems, reports, and analysis areas. In addition, virtual systems and separate customer environments can be flexibly mapped within a central instance.
Manual analyses and recurring reports take time and often provide only snapshots of individual systems. At the same time, there is frequently a lack of consistent data on which to base decisions regarding operations, management, and IT infrastructure planning.
TRIN[IT]Y erstellt individuell anpassbare Reports automatisch und stellt diese zu definierten Zeitpunkten bereit. Grafiken und Auswertungen können gespeichert sowie als Bild-, CSV- oder Excel-Dateien exportiert und flexibel weiterverarbeitet werden — etwa für Managementberichte, Kapazitätsplanungen oder regelmäßige Abstimmungen.
Automatic notifications can be sent specifically to designated users or teams. Additionally, time windows and exception periods can be taken into account—for example, for scheduled maintenance or regular post-processing.
Together, we’ll show you which data and features are truly relevant to your environment.
TRIN[IT]Y has a modular design and is tailored to the specific needs of your IT infrastructure.
This gives you exactly the features and analytics that are relevant to your IT infrastructure—without unnecessary add-ons or oversized license packages.
Together, we’ll determine which features, systems, and analytics areas are best suited to your needs and which edition is the best fit.
The following overview provides an initial overview of available editions, functional areas, and expansion options.
| Funktion | Cloud | Bronze | Silber | Gold | Cloud Provider | Platin |
|---|---|---|---|---|---|---|
| for a single LPAR (e.g. IBMi, AIX, Linux, ...) | ||||||
| IT-PS Performance Monitor - Base Framework | ||||||
| Usage of Predefined charts | ||||||
| Possibilty to create and store own graphics | ||||||
| Possibility to define Alerts incl. Mail notification | ||||||
| End-2-End Network View showing all FC Connections | ||||||
| Automatic documentation of Infrastructure and Configuration | ||||||
| Automatic creation of historical performance charts (reporting) | ||||||
| Possibility to define different Roles and Users | ||||||
| Possibility to define predictive performance Alerts (up to 20) | ||||||
| Possibiltiy for the End Customer to send in additional customer data using standard REST interfaces (e.g. application performance data) | ||||||
| "Mobile" Installation of the IT-PS Performance Monitor for e.g. Upgrade planning or troubleshooting (up to 50 times a year - 30 days each) | ||||||
| Performance monitoring of managed service customers, only eligible for Entry and Midrandge customers, excl. TRINITY Points | ||||||
| Add On | ||||||
| TRINITY SAP-Modul | ||||||
Any questions?
In a one-on-one online session, we’ll show you how TRIN[IT]Y works—based on your specific use cases.
Or do you already have specific questions? Contact us directly—we’d be happy to help.
TRIN[IT]Y supports, among other things, IBM i, AIX, SAN switches, storage systems, virtualization platforms, Power and x86 servers, as well as other IT infrastructure and performance data sources.
In addition, application and resource data can also be integrated and analyzed together.
Yes. TRIN[IT]Y consolidates IT infrastructure, configuration, and performance data across systems into a single, unified view.
This makes it possible to identify relationships between IBM i, SAN, storage, networking, virtualization, and other systems much more quickly and pinpoint potential causes—without having to manually consolidate data from multiple tools.
TRIN[IT]Y operates entirely without agents, allowing it to be quickly integrated into existing IT infrastructures—without the need to install additional software on production systems.
Thanks to its plug-and-play integration, TRIN[IT]Y is up and running in many environments in as little as 30 minutes.
We will work together to determine which systems to integrate and which features are most appropriate during a demo or evaluation meeting.
Historical performance, configuration, and IT infrastructure data can be stored long-term and used for time-series comparisons, trend analysis, capacity planning, or root cause analysis. By using InfluxDB, historical data can be stored in a space-efficient manner and searched efficiently even over long periods of time—even in large IT infrastructure environments.
The actual retention period depends on the IT infrastructure, data volume, and specific requirements.
TRIN[IT]Y was developed specifically for complex enterprise and IBM Power environments and is suitable for both medium-sized businesses and large IT infrastructure and multi-tenant environments.
Thanks to its modular design, functions and analysis areas can be flexibly adapted to meet a variety of requirements.
Yes. TRIN[IT]Y supports multi-tenant operation of multiple customer or IT infrastructure environments within a single central instance.
As a result, the solution is also suitable for managed service providers and complex enterprise environments with multiple locations or clients.
Traditional monitoring tools often analyze systems in isolation from one another. TRIN[IT]Y, on the other hand, integrates technical operational, IT infrastructure, and change data across the board, thereby enabling significantly faster root cause analysis and long-term trend assessments.
This makes correlations, changes, and potential causes much more apparent—including historical trends, time-series comparisons, and predictive alerts.
Yes. During a one-on-one online session, we’ll show you live how TRIN[IT]Y works and which features are relevant to your IT infrastructure.
Together, we will also discuss possible trial versions, suitable functional areas, and the desired evaluation period.
Any questions?
In a one-on-one online session, we’ll show you how TRIN[IT]Y works—based on your specific use cases.
Or do you already have specific questions? Contact us directly—we’d be happy to help.